Data Analytics & Business Intelligence Excellence
Connect business data, standardize reporting, and build dashboards that give teams a clear view of financial and operational performance.
Data Analytics & Business Intelligence Excellence
Connect business data, standardize reporting, and build dashboards that give teams a clear view of financial and operational performance.


What we do
Transforming Disconnected
Data into Clear
Business Decisions
Many growing organizations collect data across multiple platforms but struggle to turn it into reliable business insight:
- Reports assembled manually from spreadsheets
- Conflicting numbers across departments
- Disconnected ERP, CRM, and marketing data
- Dashboards with inconsistent KPI definitions
- Limited visibility into margins, inventory, and customer activity
These gaps delay reporting, create uncertainty, and make it difficult to identify what is driving business performance.
NEPA Works helps organizations build a consistent view of their business through connected data sources, validated reporting, and accessible dashboards. We organize information so leaders can understand results, investigate changes, and plan their next steps.
Key Areas We Focus On
✔ Data Source Integration & Consolidation
✔ ERP & CRM Reporting
✔ Business Intelligence Dashboards
✔ KPI Definitions & Reporting Standards
✔ Financial & Operational Analysis
✔ Data Quality & Validation
✔ Reporting Automation & Data Governance
What we do
Transforming Disconnected Data into Clear Business Decisions
Many growing organizations collect data across multiple platforms but struggle to turn it into reliable business insight:
- Reports assembled manually from spreadsheets
- Conflicting numbers across departments
- Disconnected ERP, CRM, and marketing data
- Dashboards with inconsistent KPI definitions
- Limited visibility into margins, inventory, and customer activity
These gaps delay reporting, create uncertainty, and make it difficult to identify what is driving business performance.
NEPA Works helps organizations build a consistent view of their business through connected data sources, validated reporting, and accessible dashboards. We organize information so leaders can understand results, investigate changes, and plan their next steps.
Key Areas We Focus On
✔ Data Source Integration & Consolidation
✔ ERP & CRM Reporting
✔ Business Intelligence Dashboards
✔ KPI Definitions & Reporting Standards
✔ Financial & Operational Analysis
✔ Data Quality & Validation
✔ Reporting Automation & Data Governance
OUR DATA ANALYTICS SOLUTIONS
OUR DATA ANALYTICS SOLUTIONS
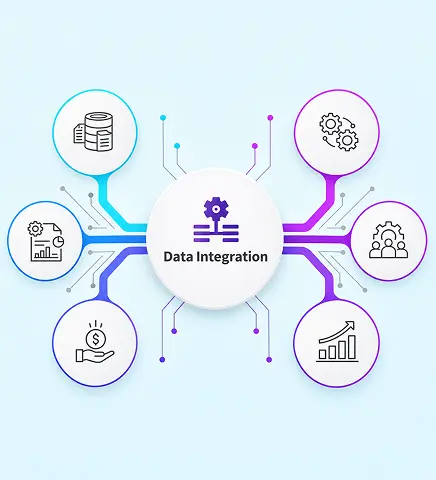










DATA QUALITY & BUSINESS VISIBILITY
DATA QUALITY & BUSINESS VISIBILITY
We measure analytics improvements against agreed reporting needs, with goals such as:
Faster Recurring Report Preparation
Greater consistency across departmental figures
Improved product and customer Profitability
Earlier identification of performance changes
Fewer reporting discrepancies
More reliable information for planning and review
We measure analytics improvements against agreed reporting needs, with goals such as:
Faster Recurring Report Preparation
Greater consistency across departmental figures
Improved product and customer profitability
Earlier identification of performance changes
Fewer reporting discrepancies
More reliable information for planning and review
DATA ANALYTICS ACROSS THE ENTERPRISE
DATA ANALYTICS ACROSS THE ENTERPRISE

Finance Forecasting
Revenue, expense, cash flow, and profitability reporting with consistent definitions.

Supply Chain & Inventory
Stock availability, inventory turnover, aging, and supplier performance analysis.

Marketing Performance
Channel, campaign, and website reporting linked to defined business objectives.

Sales & Account Management
Pipeline visibility, sales trends, purchasing frequency, and account performance.

HR & Workforce Planning
Workforce costs, attendance, and operational capacity reporting with appropriate access controls.

Customer Care
Response times, resolution rates, recurring issues, and customer feedback analysis.

Finance Forecasting
Revenue, expense, cash flow, and profitability reporting with consistent definitions.

Supply Chain & Inventory
Stock availability, inventory turnover, aging, and supplier performance analysis.

Marketing Performance
Channel, campaign, and website reporting linked to defined business objectives.

Sales & Account Management
Pipeline visibility, sales trends, purchasing frequency, and account performance.

HR & Workforce Planning
Workforce costs, attendance, and operational capacity reporting with appropriate access controls.

Customer Care
Response times, resolution rates, recurring issues, and customer feedback analysis.
Make Business Performance Easier to Understand
Give your teams a consistent view of the numbers behind their decisions. Partner with NEPA Works to connect data sources, clarify KPIs,
and build reporting that supports daily operations and long-term planning.
Move Business Performance Easier to Understand
Give your teams a consistent view of the numbers behind their decisions. Partner with NEPA Works to connect data sources, clarify KPIs,
and build reporting that supports daily operations and long-term planning.
Discuss Your Analytics RequirementsExpert Team
INTEGRATED WITH SHARED SERVICES
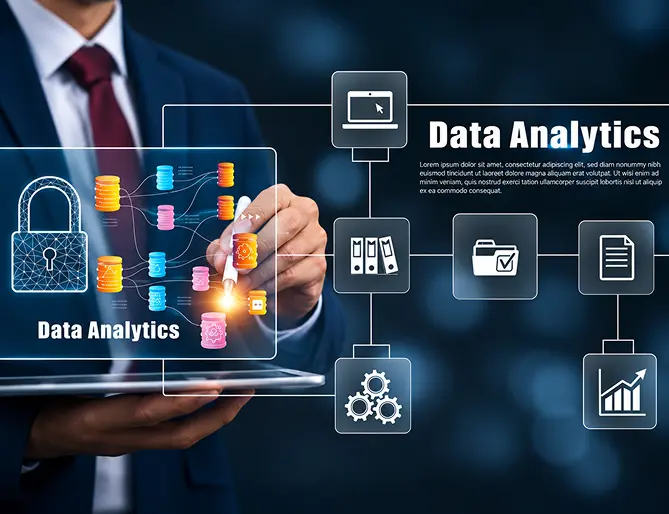
Data Analytics provides performance visibility across the NEPA Works shared services architecture. Our reporting systems connect:
Finance
Enterprise Technology
Marketing & Sales
Supply Chain
HR
Customer care
AI
Shared definitions help every department work from a consistent understanding of business performance.
Expert Team
INTEGRATED WITH SHARED SERVICES
Data Analytics provides performance visibility across the NEPA Works shared services architecture. Our reporting systems connect:
Finance
Enterprise Technology
Marketing & Sales
Supply Chain
HR
Customer care
AI
Shared definitions help every department work from a consistent understanding of business performance.
Subscribe for Data Analytics & Business Intelligence Insights
Frequently asked questions
Here are some common questions about our Data Analytics & Business Intelligence Insights.
NEPA Works provides data integration, business intelligence dashboards, financial and operational analysis, KPI reporting, data validation, and reporting automation to improve business visibility.
Yes, NEPA Works can consolidate data from compatible ERP, CRM, finance, marketing, and operational systems into a reporting environment with defined sources and update schedules.
Business intelligence dashboards can display revenue, margins, sales pipelines, inventory movement, campaign performance, and service metrics, with views tailored to leadership and departmental priorities.
Data analytics helps teams understand performance, investigate changes, compare results, and identify operational bottlenecks using consistent metrics and accessible reporting.
Yes, profitability analysis can examine revenue, expenses, and margins by product, customer, location, or business unit, helping teams identify where costs or performance require attention.
Yes, data analytics can track stock availability, inventory turnover, aging, order fulfillment, and supplier performance to help teams identify slow-moving inventory and operational delays.
Recurring reports can be automated, while dashboard refresh frequency depends on source systems, integration capabilities, and reporting requirements, with real-time updates available where supported.
NEPA Works establishes KPI definitions, validates records, assigns reporting ownership, and applies access controls to reduce discrepancies and support consistent reporting across departments.